Build a new drill-down report
Use these instructions for building a new drill-down report. Creating a report that has filters, and saving it in the drill-down interface, saves the advanced filter.
To build a new report:
- Do one of the following:
- Near the top of the page on the right, click Create New Report.
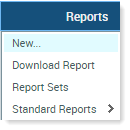
In the header menu, click Reports > New.
-
Of the tabs on the right side of the page (Claims, Line Items), click the tab for the type of data being retrieved. The Claims and Line Items tabs contain information found on the patient’s UB04 or 837 claim forms, and resides within Axiom Contract Management.
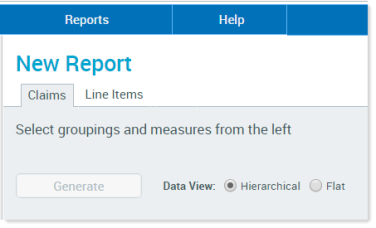
On the left side of the page are two tabs, Groupings and Measures.
NOTE: You must select at least one parameter from both tabs to generate and display a report.
-
On the left side of the page, in the Groupings tab, click the plus sign (+) to expand any folders as needed to locate report groupings options.
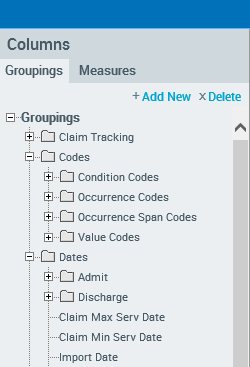
-
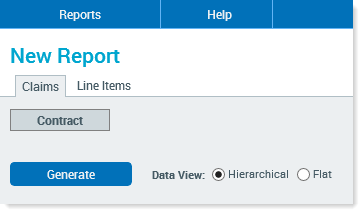
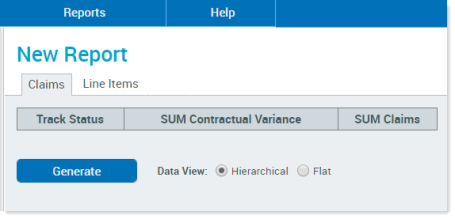
Double-click a groupings option to add it to the report. When added, that option displays on the right side of the page above the Generate button, as shown in the following example. Select more row groupings if desired.
NOTE: If you select more than three groupings, only the first three display when you generate the report in hierarchical view. All groupings display when you generate a report in flat view.
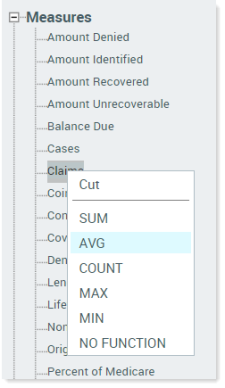
- Click the Measures tab, expand any folders as needed, and then double-click the desired measures, one at a time, to add them to the report. If you do not see the measure you need, you can create one. See Add calculated fields to a report.
- To add a measure to the report as SUM of that measure, double-click the measure.
To add a different calculation, right-click the measure, and select a calculation option from the menu as shown in the following example.
When you chose the calculation option for the desired measure, the selected measure displays to the right of the selected grouping. This is the order in which the columns in the report display. You can rearrange them or delete a grouping or measure before or after you generate the report if you change your mind.
- To remove any selected options from the report before generating, right-click the option, and select Delete.
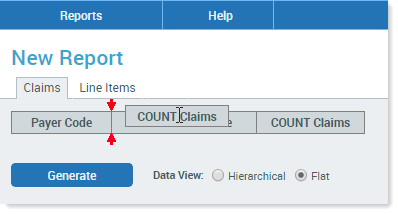
To rearrange report columns, drag and drop the columns to the desired order. In the following example, the user drags the measure COUNT claims to the middle row. The red arrows show where the measure label will start, which in this example, is after Payer Code:
- In the Data View section to the right of the Generate button, select the report grid type:
- Hierarchical – Select this option to display the report with grouping columns arranged in a hierarchy.
- Flat – Select this option to display the report with grouping columns arranged side-by-side.
- Click Generate.
- If desired, save the report so you can use it later.
